
Answers − Plotting Quadratic Graphs 2
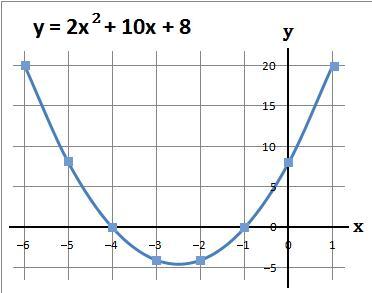
1. Plot the graph y = 2x2 + 10x + 8 when x is −6, −3 and 0. There are also the coordinates (−5, 8), (−4, 0), (−2, −4), (−1, 0) and (1, 20)
| (a) Using a table work out the values of y |
y = 2x2 + 10x + 8
|
| (b) The coordinates of the above are (−6, 20), (−5, 8), (−4, 0), (−3, −4), (−2, −4), (−1, 0), (0, 8) and (1, 20) |
| (c) Plot the above coordinates and draw a line through these points |
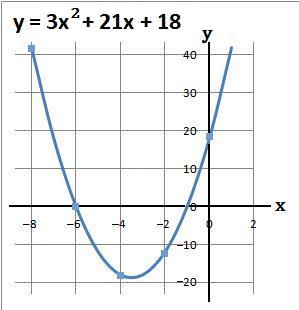
2. Plot the graph y = 3x2 + 21x + 18 when x = −8, −4 and 0. There are also the coordinates (−6, 0) and (−2, −12)
| (a) Using a table work out the values of y |
y = 3x2 + 21x + 18
|
| (b) The coordinates of the above are (−8, 42), (−6, 0), (−4, −18), (−2, −12) and (0, 18) |
| (c) Plot the above coordinates and draw a line through these points |
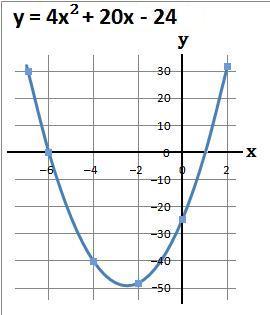
3. Plot the graph y = 4x2 + 20x − 24 when x = −6, −2 and 2. There are also the coordinates (−4, −40) and (0, −24)
| (a) Using a table work out the values of y |
y = 4x2 + 20x − 24
|
| (b) The coordinates of the above are (−6, 0), (−4, −40), (−2, −48), (0, −24) and (2, 32) |
| (c) Plot the above coordinates and draw a line through these points |
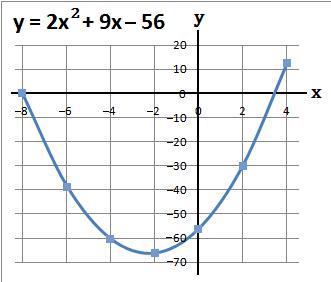
4. Plot the graph y = 2x2 + 9x − 56 when x = −8, −2 and 4. There are also the coordinates (−6, −38), (−4, −60), (0, −56) and (2, −30)
| (a) Using a table work out the values of y |
y = 2x2 + 9x − 56
|
| (b) The coordinates of the above are (−8, 0), (−6, −38), (−4, −60), (−2, −66), (0, −56), (2, −30) and (4, 12) |
| (c) Plot the above coordinates and draw a line through these points |
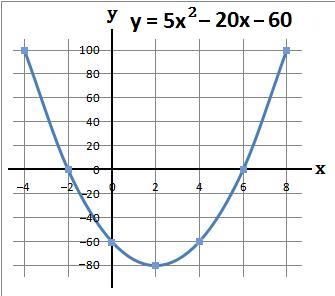
5. Plot the graph y = 5x2 − 20x − 60 when x = −4, 2 and 8. There are also the coordinates (−2, 0), (0, −60), (4, −60) and (6, 0)
| (a) Using a table work out the values of y |
y = 5x2 − 20x − 60
|
| (b) The coordinates of the above are (−4, 100), (−2, 0), (0, −60), (2, −80), (4, −60), (6, 0) and (8, 100) |
| (c) Plot the above coordinates and draw a line through these points |
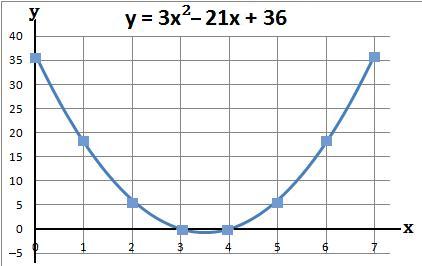
6. Plot the graph y = 3x2 − 21x + 36 when x = 0, 3 and 6. There are also the coordinates (1, 18), (2, 6), (4, 0), (5, 6) and (7, 36)
| (a) Using a table work out the values of y |
y = 3x2 − 21x + 36
|
| (b) The coordinates of the above are (0, 36), (1, 18), (2, 6), (3, 0), (4, 0), (5, 6), (6, 18) and (7, 36) |
| (c) Plot the above coordinates and draw a line through these points |
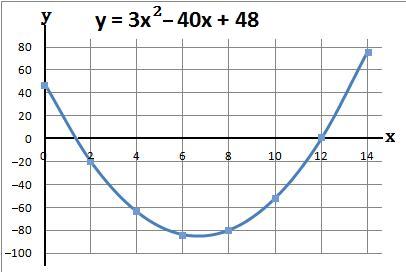
7. Plot the graph y = 3x2 − 40x + 48 when x = 0, 6 and 12. There are also the coordinates (2, −20), (4, −64), (8, −80), (10, −52) and (14, 76)
| (a) Using a table work out the values of y |
y = 3x2 − 40x + 48
|
| (b) The coordinates of the above are (0, 48), (2, −20), (4, −64), (6, −84), (8, −80), (10, −52), (12, 0) and (14, 76) |
| (c) Plot the above coordinates and draw a line through these points |