
Answers − Quadratic Graphs using x and y axis − 1
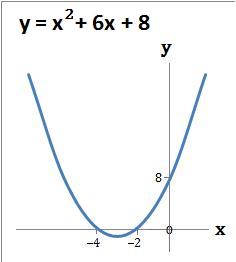
1. Draw the graph y = x2 + 6x + 8
| (a) The graph crosses the y axis at the number term c which is 8. When x = 0 then y = 8. The coordinate is (0, 8) |
| (b) The graph crosses the x axis where x2 + 6x + 8 = 0. Refer to question 1 of Solve Quadratics by Factorising - 1. So y = 0 when x = −4 or −2. The coordinates are (−4, 0) and (−2, 0) |
| (c) Draw the graph using the above coordinates |
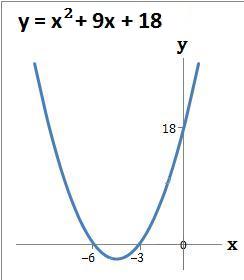
2. Draw the graph y = x2 + 9x + 18
| (a) The graph crosses the y axis at the number term c which is 18. When x = 0 then y = 18. The coordinate is (0, 18) |
| (b) The graph crosses the x axis where x2 + 9x + 18 = 0. Refer to question 2 of Solve Quadratics by Factorising - 1. So y = 0 when x = −6 or −3. The coordinates are (−6, 0) and (−3, 0) |
| (c) Draw the graph using the above coordinates |
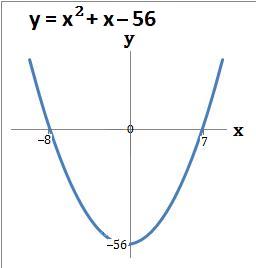
3. Draw the graph y = x2 + x − 56
| (a) The graph crosses the y axis at the number term c which is −56. When x = 0 then y = −56. The coordinate is (0, −56) |
| (b) The graph crosses the x axis where x2 + x − 56 = 0. Refer to question 3 of Solve Quadratics by Factorising - 1. So y = 0 when x = −8 or 7. The coordinates are (−8, 0) and (7, 0) |
| (c) Draw the graph using the above coordinates |
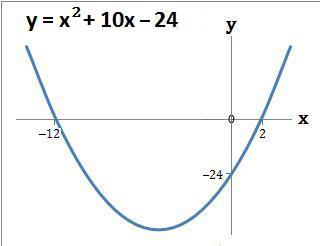
4. Draw the graph y = x2 + 10x − 24
| (a) The graph crosses the y axis at the number term c which is −24. When x = 0 then y = −24. The coordinate is (0, −24) |
| (b) The graph crosses the x axis where x2 + 10x − 24 = 0. Refer to question 4 of Solve Quadratics by Factorising - 1. So y = 0 when x = −12 or 2. The coordinates are (−12, 0) and (2, 0) |
| (c) Draw the graph using the above coordinates |
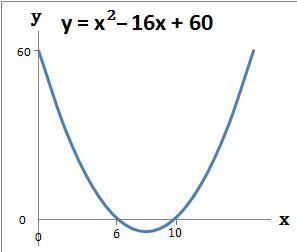
5. Draw the graph y = x2 − 16x + 60
| (a) The graph crosses the y axis at the number term c which is 60. When x = 0 then y = 60. The coordinate is (0, 60) |
| (b) The graph crosses the x axis where x2 − 16x + 60 = 0. Refer to question 5 of Solve Quadratics by Factorising - 1. So y = 0 when x = 6 or 10. The coordinates are (6, 0) and (10, 0) |
| (c) Draw the graph using the above coordinates |
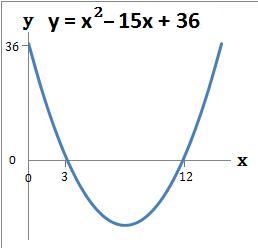
6. Draw the graph y = x2 − 15x + 36
| (a) The graph crosses the y axis at the number term c which is 36. When x = 0 then y = 36. The coordinate is (0, 36) |
| (b) The graph crosses the x axis where x2 − 15x + 36 = 0. Refer to question 6 of Solve Quadratics by Factorising - 1. So y = 0 when x = 3 or 12. The coordinates are (3, 0) and (12, 0) |
| (c) Draw the graph using the above coordinates |
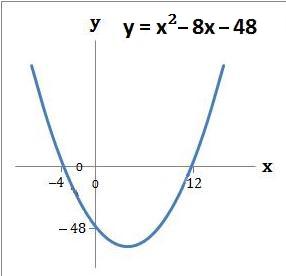
7. Draw the graph y = x2 − 8x − 48
| (a) The graph crosses the y axis at the number term c which is −48. When x = 0 then y = −48. The coordinate is (0, −48) |
| (b) The graph crosses the x axis where x2 − 8x − 48 = 0. Refer to question 7 of Solve Quadratics by Factorising - 1. So y = 0 when x = −4 or 12. The coordinates are (−4, 0) and (12, 0) |
| (c) Draw the graph using the above coordinates |