

Scatter Diagrams
Scatter diagrams show the link between two variables. The variables are plotted as coordinates. This link shows the correlation (relationship) between the two variables.
There are 3 types of correlation
| 1. | Positive correlation |
| As the value of the first variable increases so does the second | |
| 2. | Negative correlation |
| As the value of the first variable increases the second decreases | |
| 3. | No correlation |
| No linear relationship between the variables | |
- Example 1. Plot a scatter diagram of this table, what type of correlation is there?
- Example 2. Plot a scatter diagram of this table, what type of correlation is there?
- Example 3. Plot a scatter diagram of the two tests, what type of correlation is there?
| Height m | 1 | 2 | 3 | 4 | 5 | 6 |
| Weight kg | 4 | 5 | 6 | 7 | 9 | 9 |
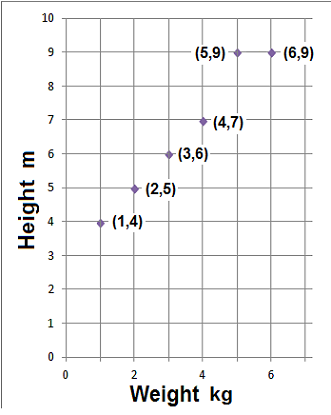
There is a Postive Correlation
| Age in Years | 1 | 2 | 3 | 4 | 5 |
| Value of Car £000s | 19 | 16 | 15 | 14 | 12 |
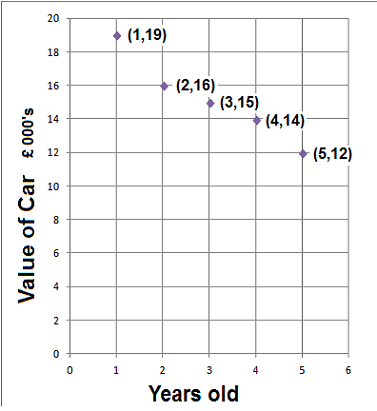
There is a Negative Correlation
| Art | 6 | 9 | 1 | 2 | 6 | 2 | 10 |
| Maths | 5 | 19 | 10 | 7 | 12 | 18 | 12 |
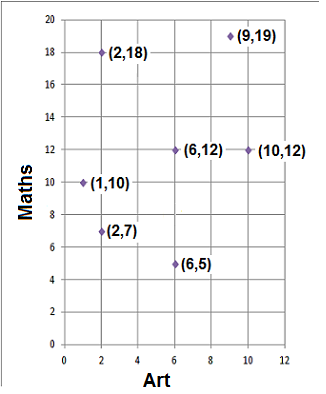
There is No Correlation